During Summer 2023 I worked at Nasdaq, the American Stock Exchange/fintech company in NYC as a UI/UX Design intern. I worked at the Nasdaq iLab which is the internal incubator where different business units under the Investment Intelligence division come to test different ideas. I specifically worked on an analytics dashboard for Nasdaq Data Link, and then continued doing work for Nasdaq Data Link during the schoolyear on a data onboarding project. This write-up is not super descriptive due to a NDA, but I was given permission to share some of the information. If you are interested in learning more about my work on this project, I am happy to share privately.
Summer 2023/Fall 2023
UI/UX Design, User Interviews
Figma
UI/UX Design, User Interviews
Figma

Project 1: User Dashboard
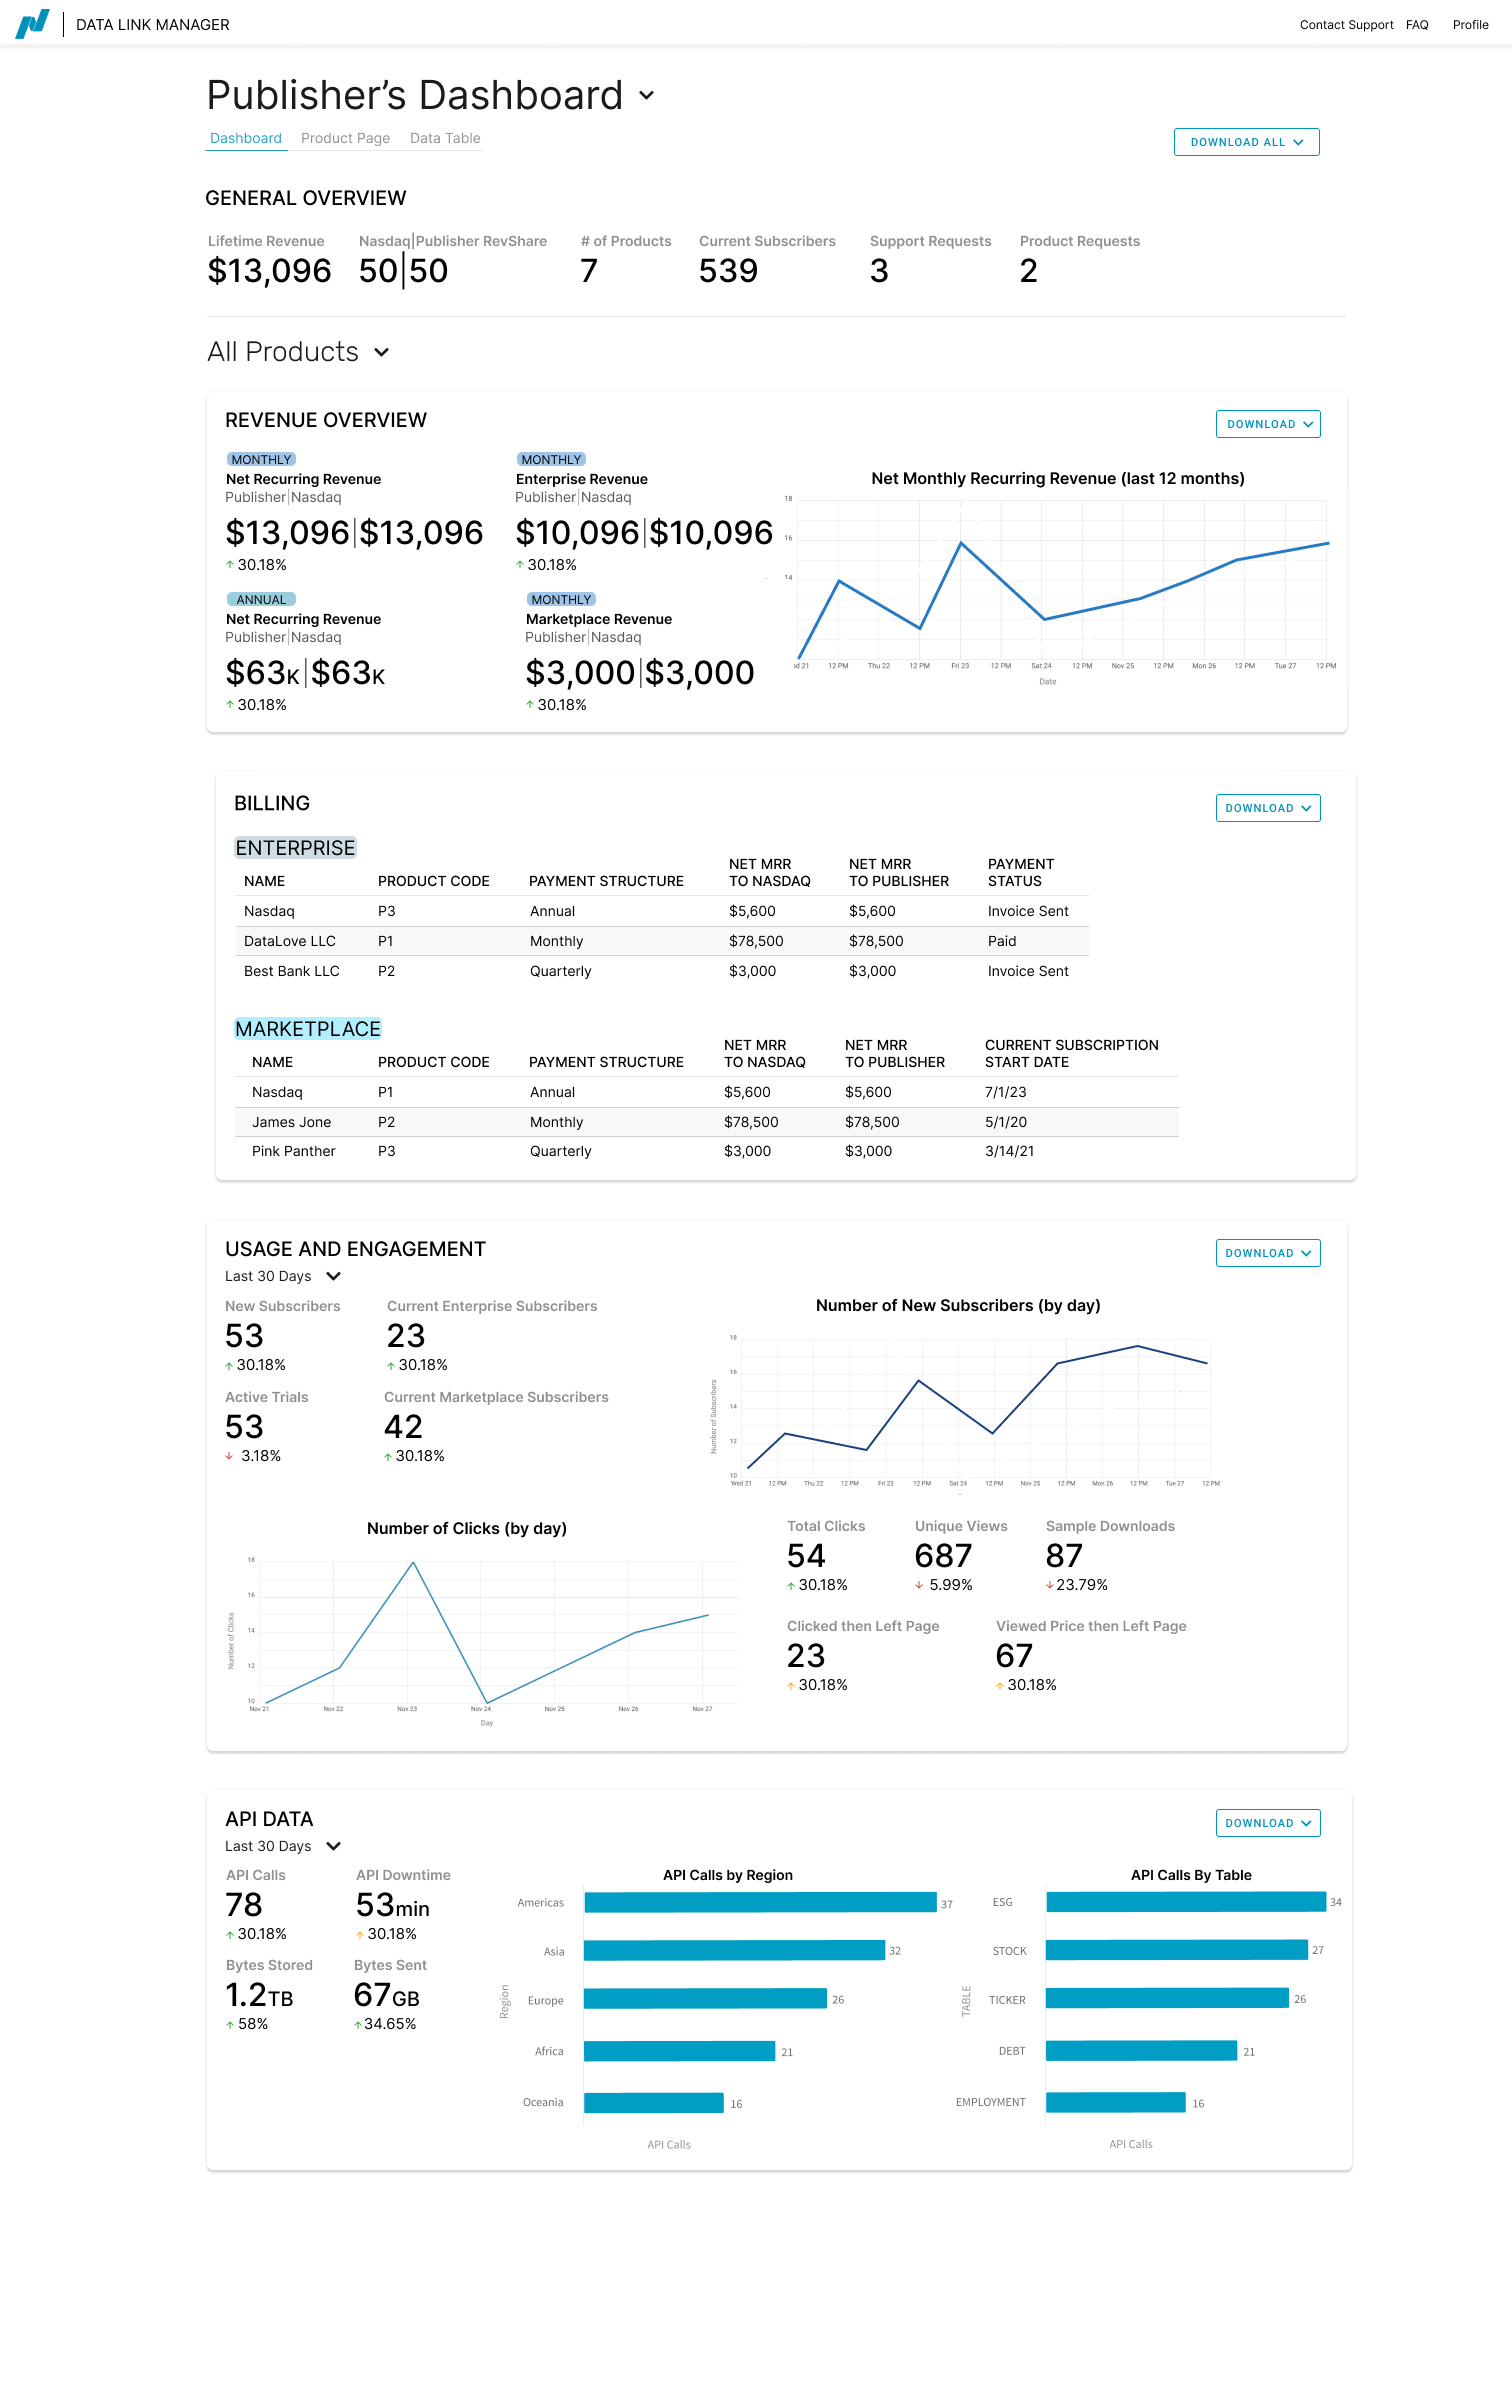
 Final Draft of the Internal Analytics Dashboard
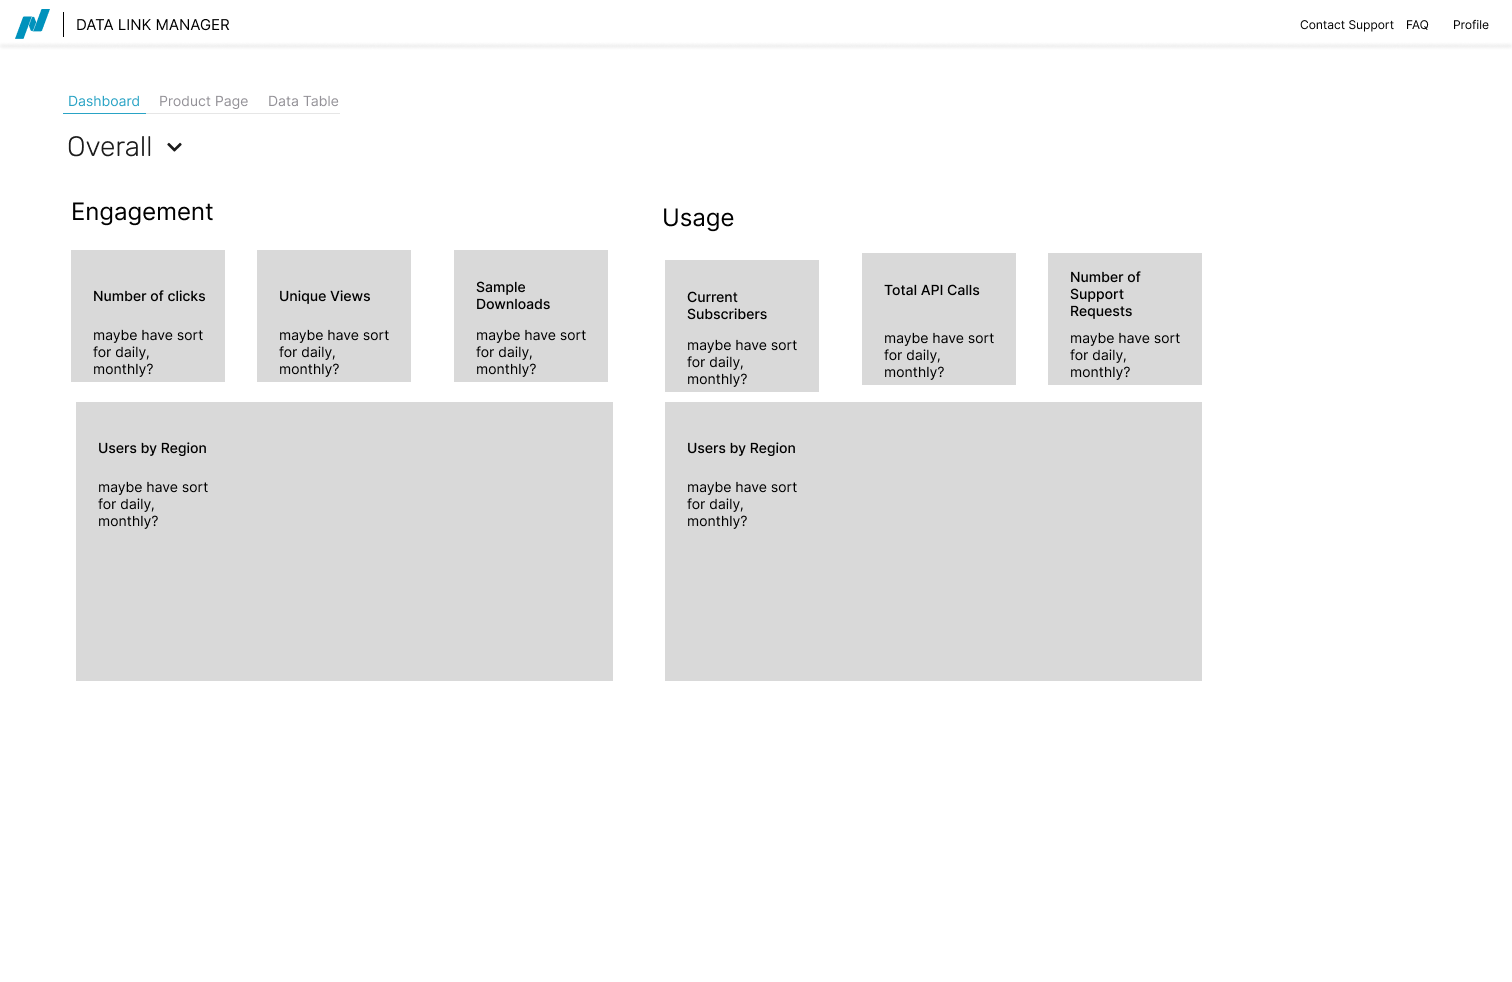
 Early Draft of the Prototype
Nasdaq Data Link (NDL) is a Nasdaq product where companies can sell their data, and also allows for internal data products to be accessed. Currently, there is no way for publishers (those who have their data on NDL) to see any analytics around the data they are selling outside of a CSV they are sent every now and then, and NDL was interested in testing the idea of having a dashboard.
I was the designer on this project, working with two engineering interns. We started off by learning more about what kind of data is on NDL, and what analytics information is available to use. We chose some Key Performance Indicators (KPIs) we thought would be most interesting/relevant to the publishers, then validated those with internal stakeholders to start. I made some low fidelity wireframes to help visualize what a dashboard might look like.
We continued to talk with internal stakeholders across engineering, strategy, and product, and I worked with our sales team to set up some user interviews with publishers, as I consider user interviews essential when working on any kind of project.
I created a higher fidelity wireframe for the user interviews, and we were able to get insight on areas including:
1. What publishers currently do in terms of data analytics with the data they receive from Nasdaq (if anything), and if they would be interested in having a dashboard?
2. What fields feel missing to publishers from the wireframe or what fields feel irrelevant?
3. What do other platforms publishers use provide them (analytics, services, etc) that they like that we do not provide?
After the interviews, I worked with my manager to distill the feedback and prioritize changes/suggestions. I also discussed the requests with other stakeholders, and specifically those on strategy and sales were concerned about certain analytics being shown to publishers that perhaps may not be performing super well. For example, a published would likely not enjoy seeing 0 new subscribers. One idea I had to combat this was to provider publishers with ideas on how to improve performance, based on analytics they want to improve, but the team decided this could potentially be future functionality.
I updated the wireframe, also including components from the Nasdaq Experience Framework (design system) and after several more sessions, we came up with 3 final drafts: one for internal Nasdaq users with additional information available, one for external publishers, and a “risk averse” version for publishers with certain data omitted.
I presented the final version to people across Nasdaq and it was well received, and I ultimately got invited to help with another project for NDL.
Project 2: Data Onboarding
NDL was working on improving the data onboarding process for publishers and our internal team. Currently, those onboarding need to fill out an extensive form, and there ends up being a lot of back and forth as the data and information is validated.
I helped with going through the current process and seeing where there could be User Experience improvements, and helping mock up what the improvements might look like.
I helped with going through the current process and seeing where there could be User Experience improvements, and helping mock up what the improvements might look like.